Available Filters in the Executive Dashboard
How to filter information in the Executive Dashboard
CaptuData allows you to view information in an organized way through the use of predefined filters. These filters help segment data and display only the information that is relevant.
🔹 Using filters in the Executive Dashboard
Log in to CaptuData Web.
Go to the Executive Dashboard.
At the top of the screen, you will find the system filters.
Select the search criteria you need (e.g., program, status, location, etc.).
The system will display only the works or projects that match those criteria.
In the following image, you can see an example of how the filters are applied in practice. ✅}
Viewing Information Using Filters
The use of filters in the Executive Dashboard allows you to access information in a simple and organized way.
🔹 How the data is displayed
When filters are applied, the works are displayed on the right side of the screen.
On the map, you can view the location of each work, as applicable.
🔹 Types of filters available
CaptuData provides different filters to adjust the visualization of general information. Among them:
Country
Program Status
Program
These filters allow you to customize the view according to your needs.
Additionally, it is possible to enable a function to also display inspection data related to the selected works.
Total Works View
Total Inspections View
Filter Works or Projects by Physical Progress Percentage
In addition to the general filters, the system allows you to filter works or projects by their percentage of physical progress. This option makes it easier to track projects based on their progress.
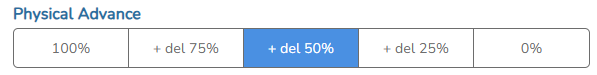
🔹 How to use the physical progress filter
In the Executive Dashboard, locate the physical progress filters.
Click on the progress percentage you want to view (e.g., 0–25%, 26–50%, etc.).
The system will display only the works or projects that fall within that selected range.
The selected percentage will be highlighted in blue, indicating which information is currently being displayed.
Related Articles
How Are Works Displayed?
Viewing Works Works can be displayed from the Executive Dashboard, in a list located on the right side of the screen. ? Works Display The list shows the available works according to the filters applied at the top of the screen (e.g., status, ...Available Actions in the Projects Panel
View and manage information for a work site or project in CaptuData In this space, you can review and manage all information related to the selected work site or project. 🔹 What you can do in this view Depending on your user profile, you will be ...Downloading Data in CaptuData
How to Download the Executive View in CaptuData The CaptuData system allows you to download the data currently displayed, based on the filters you have applied. The downloaded file is an Excel (.xlsx) document that contains basic information about ...User Roles in CaptuData
CaptuData offers different user roles that allow each organization to manage information in a secure and controlled way, according to the responsibilities of participants in each project or work. Below are the available roles and their functions: ...How to View a Project’s Inspections
View a Project’s Inspections The system allows you to review all inspections linked to a specific project or work site directly from the main dashboard. ? Steps to View Inspections Open the Projects Dashboard Go to the Projects/Works panel and ...